Creating Custom Geoprocessing Tools with Python Scripts
While I think many GIS analysts cherish Python for its ability to automate large-scale geoprocessing tasks and do a lot of the heavy lifting when it comes to data management, I find that its true creative power lies in creating custom geoprocessing scripts. So just to back up for a moment, we know that all GIS applications are based on the idea of passing spatial files (i.e. shapefiles, rasters, feature classes) through script tools that do something to these files. These scripts, nowadays, are often written in Python, especially after Esri began writing all of their tools in this language. For most GIS users, however, script tools operate almost like a black box – files are passed into them and new files pop out. While we all have an understanding of what the input needs to look like and what the output should look like, what happens in the middle actually remains fairly opaque. This obscurity was something that initially frustrated me when I first began using GIS. I wanted to know more about what was actually going on "under the hood" and to be able to manipulate that process to make different things happen.
So for this second project, I posed a new challenge to myself – to create a custom geoprocessing tool and, in the process, learn more about how geoprocessing tools actually function. My advisor, Joseph Holler, suggested that I try making a tool that would tackle a somewhat tricky (though regularly used) technique in GIS, something known as areal-weighted reaggregation (AWR). The goal of AWR is to get data that is aggregated by one areal unit and reaggregate this data by a different areal unit, particularly for the case when the areal units are not nested. The script I wrote for Project #1 uses areal-weighted reaggregation, taking Census data that gives the number of people of each race in each block group and reaggregating it by the Chicago Police Department's beats (patrol areas). This is ultimately what allows us to relate the density of arrests for possession of certain drugs in each beat to the racial makeup of that same beat.
So why is creating a tool to do this process actually useful? Well, areal-weighted reaggregation is a surprisingly common technique that needs to be performed regularly when working with spatial data. All too often, we have data aggregated by one areal unit, but we need it aggregated by a different areal unit. By creating a custom tool to do this process, we can use it on any problem that has the required inputs. For example, take the Chicago map I made in Project #1. With a custom AWR tool, we could make the same type of map for every city in the United States, or for every major city in the world (assuming reliable and extant data – which you really can never assume). Or let's say you're interested in completely different statistics (age, gender, socioeconomic class, education, etc.) or completely different scales of analysis (i.e. counties, states, countries, continents). Again, this tool can do that type of analysis as well. The power of creating custom tools is in their diversity of application, their ability to be applied to many different contexts and problems. The script from Project #1 is limited in the sense that it only works for one particular case (singularity of application).
Alright, now for the goods. Click here to access my script for the Areal-Weighted Reaggregation tool. So, a little explanation of the tool itself. The tool has a fair amount of parameters that need to be entered (because, well, it does a fair amount of things). These include:
- Workspace – where are you storing your files that you're working with? The script needs to know this in order to know where to look on your computer to get at the files of interest.
- Data Feature Class – the feature class holding your data of interest. This is the file that contains the aggregated data that you will be reaggregating. For example, if you have data in block groups and you want to get it by police beats, your block groups feature class would be the input for this parameter.
- Areal Unit Feature Class – the feature class holding your areal unit of interest. This is the file that contains the areal units by which you are reaggregating. For example, if you have data in block groups and you want to get it by police beats, your police beats feature class would be the input for this parameter.
- Dissolve Field – the field in your areal unit feature class that uniquely identifies each areal unit in the feature class. Your data will be reaggregated (dissolved) based on this field. For example, in your police beats feature class, there is likely a field (i.e. BEAT_NUM) that uniquely identifies each police beat. This would be the input for this parameter.
- Intersect Feature Class – the intersect feature class created as part of the areal-weighted reaggregation. This is one of two outputs created by the tool and includes the result of an intersect analysis between your data feature class and areal unit feature class. This feature class isn't necessarily imperative for analysis, but it does have all sorts of applications within and beyond running an AWR. For this parameter, you provide a name and the script will write the intersect feature class with that name.
- Statistic Field(s) – the field(s) that you actually want to aggregate (SUM) in the output feature class. These fields are the data of interest contained in your data feature class. For example, if I wanted to aggregate the number of Black, White, Hispanic, and Asian people by police beat, I would select fields "BLACK", "WHITE", "HISPANIC", and "ASIAN" for this parameter. Note that this parameter can be any numerical input (it would likely not work for strings, although I can't say I've tested that).
- Output Feature Class – the output of our areal-weighted reaggregation. The output feature class of our AWR will provide the statistics specified in the parameter above reaggregated by the areal units specified in the Dissolve Field parameter. These statistics will appear with a prefix "SUM_" and a suffix "_awr". For example, performing an AWR on the Chicago data outputs the following fields in the output feature class: "SUM_WHITE_awr", "SUM_BLACK_awr", "SUM_HISPANIC_awr", "SUM_ASIAN_awr", "SUM_MULT_RACE_awr."
To ensure that the tool actually worked on more than just the Chicago data, I ran it on a similar dataset for North Carolina and Indiana. In this problem, I used my custom AWR script to take data for the number of black and white people in each Census block group and reaggregate by house district. The results are pictured below.
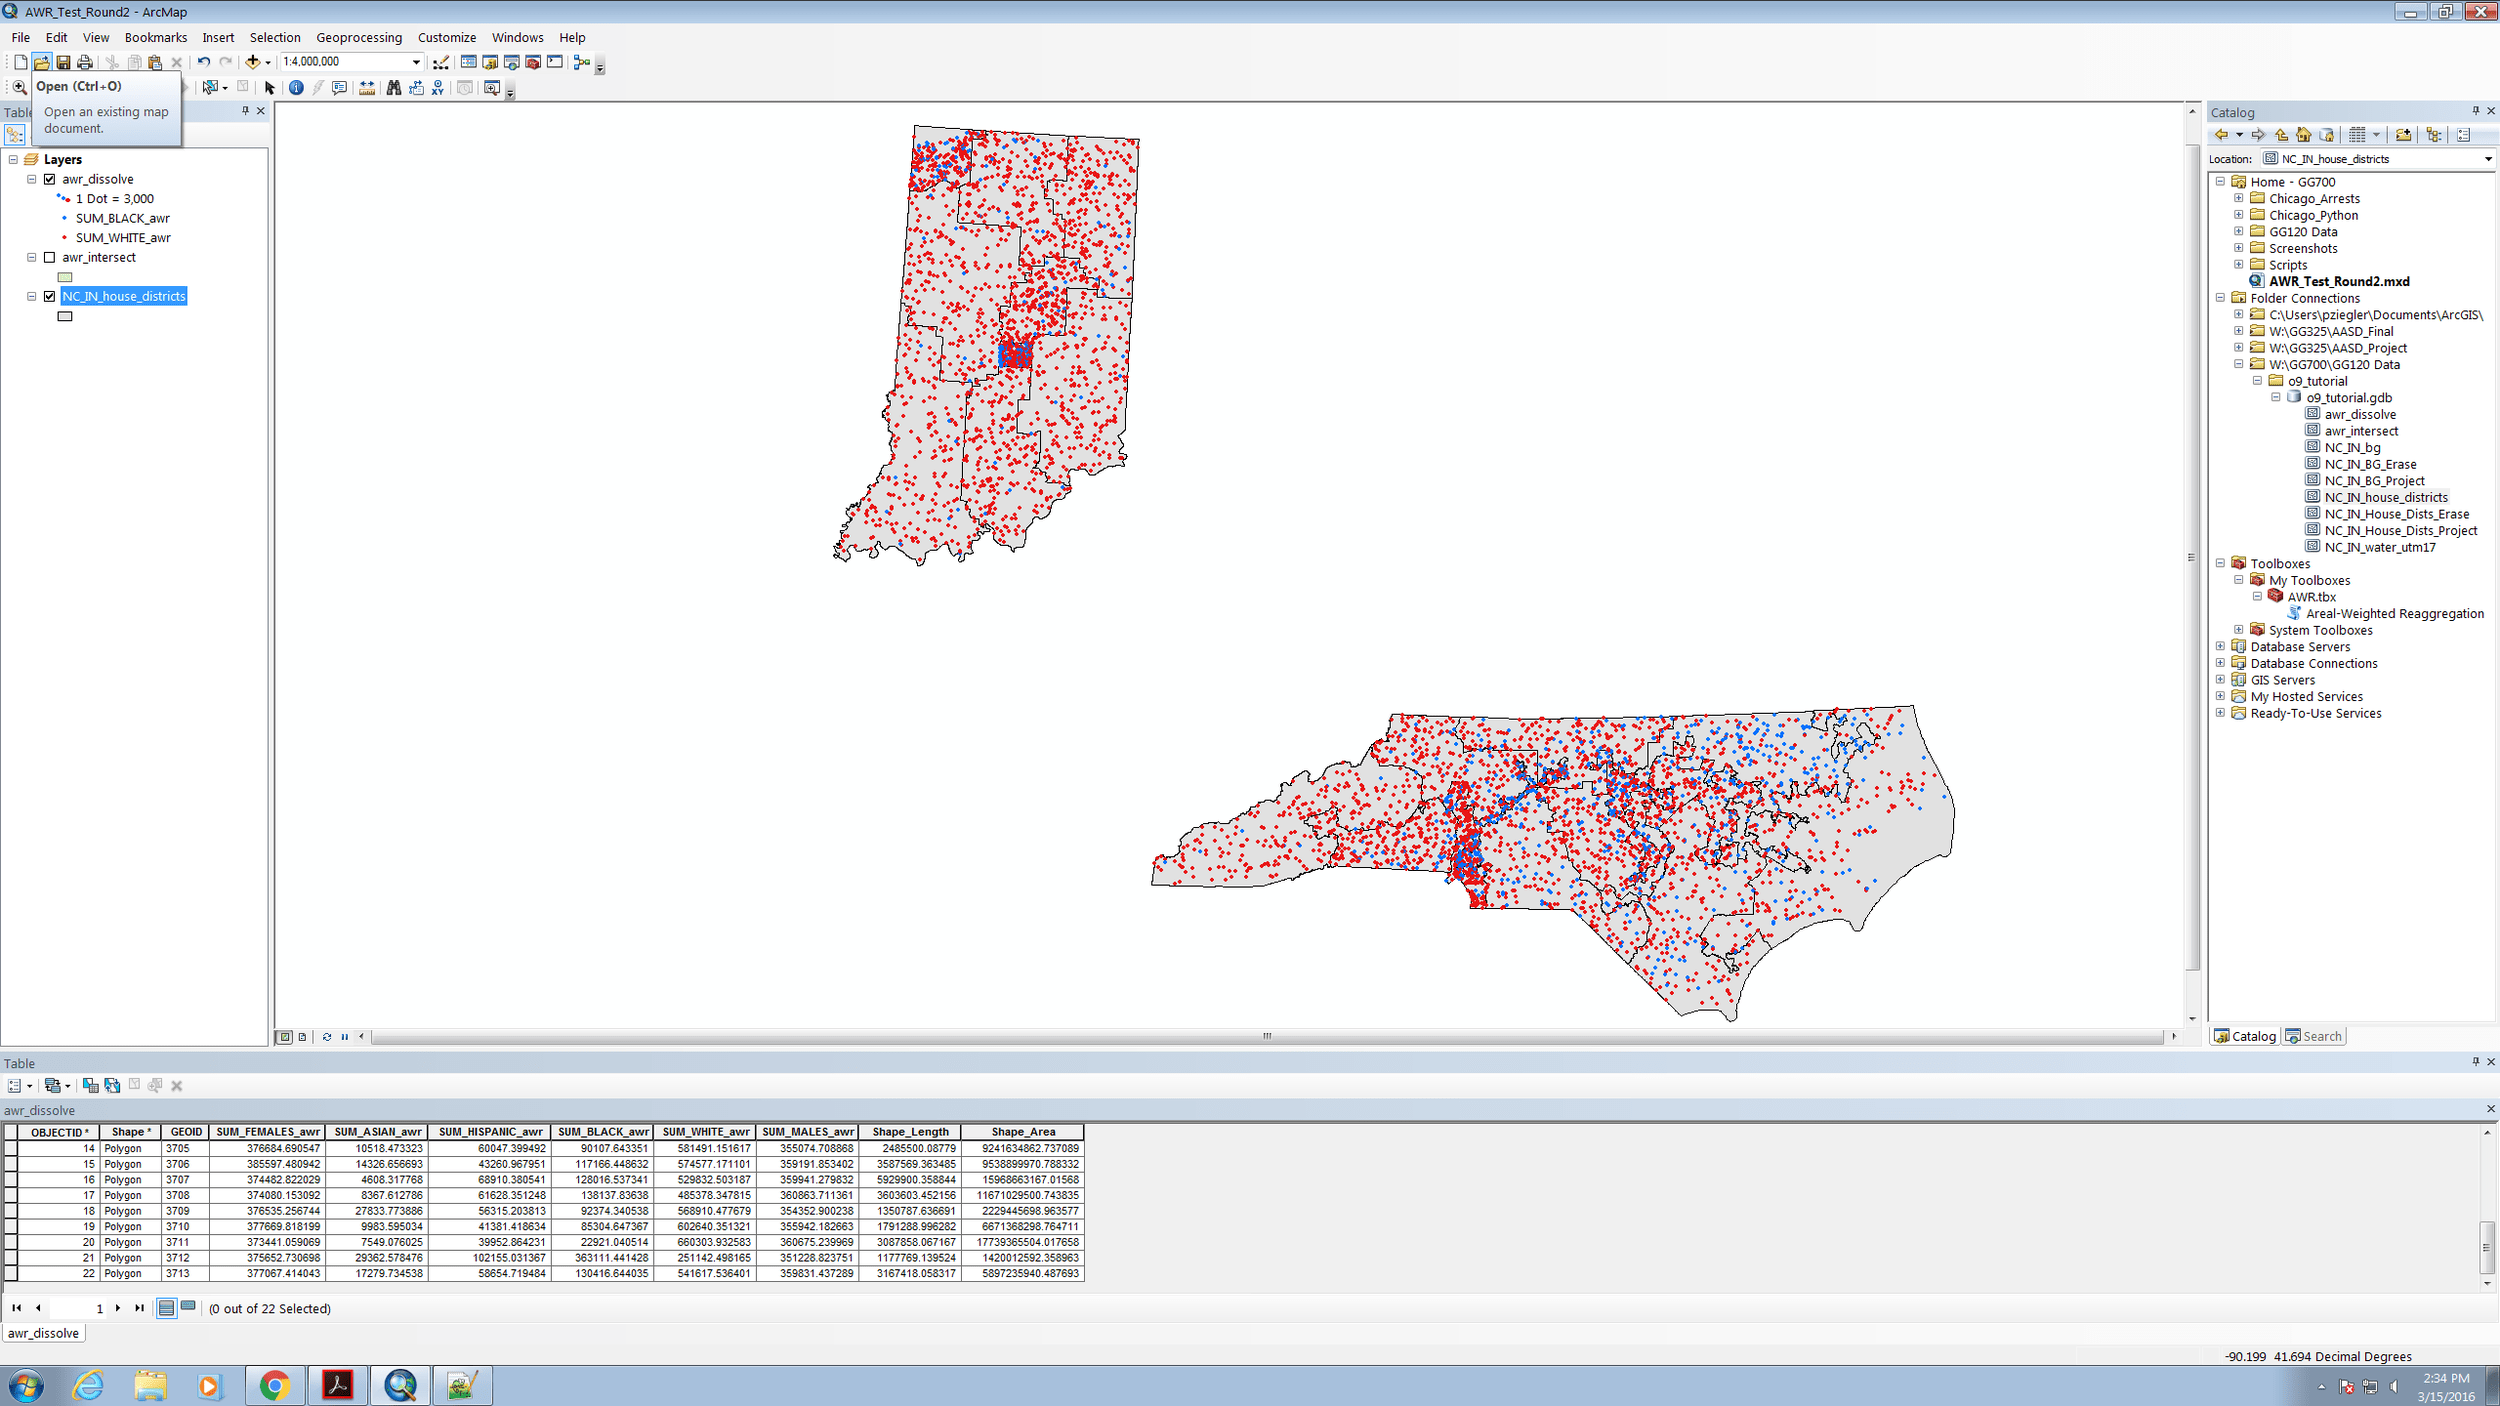
Notice the fields in the attribute table "SUM_WHITE_awr", "SUM_BLACK_awr", etc. These are the outputs of the tool and are visualized on the map on screen. Notice as well that I also included the number of males and females as statistics in my AWR – you can imagine, however, that distribution of men and women might be more homogenous than race.
Ah, the sweet feeling of success when a custom tool runs correctly. Be wary that as the number of features in your feature classes increases, so does the amount of time it will take for the script to properly run.
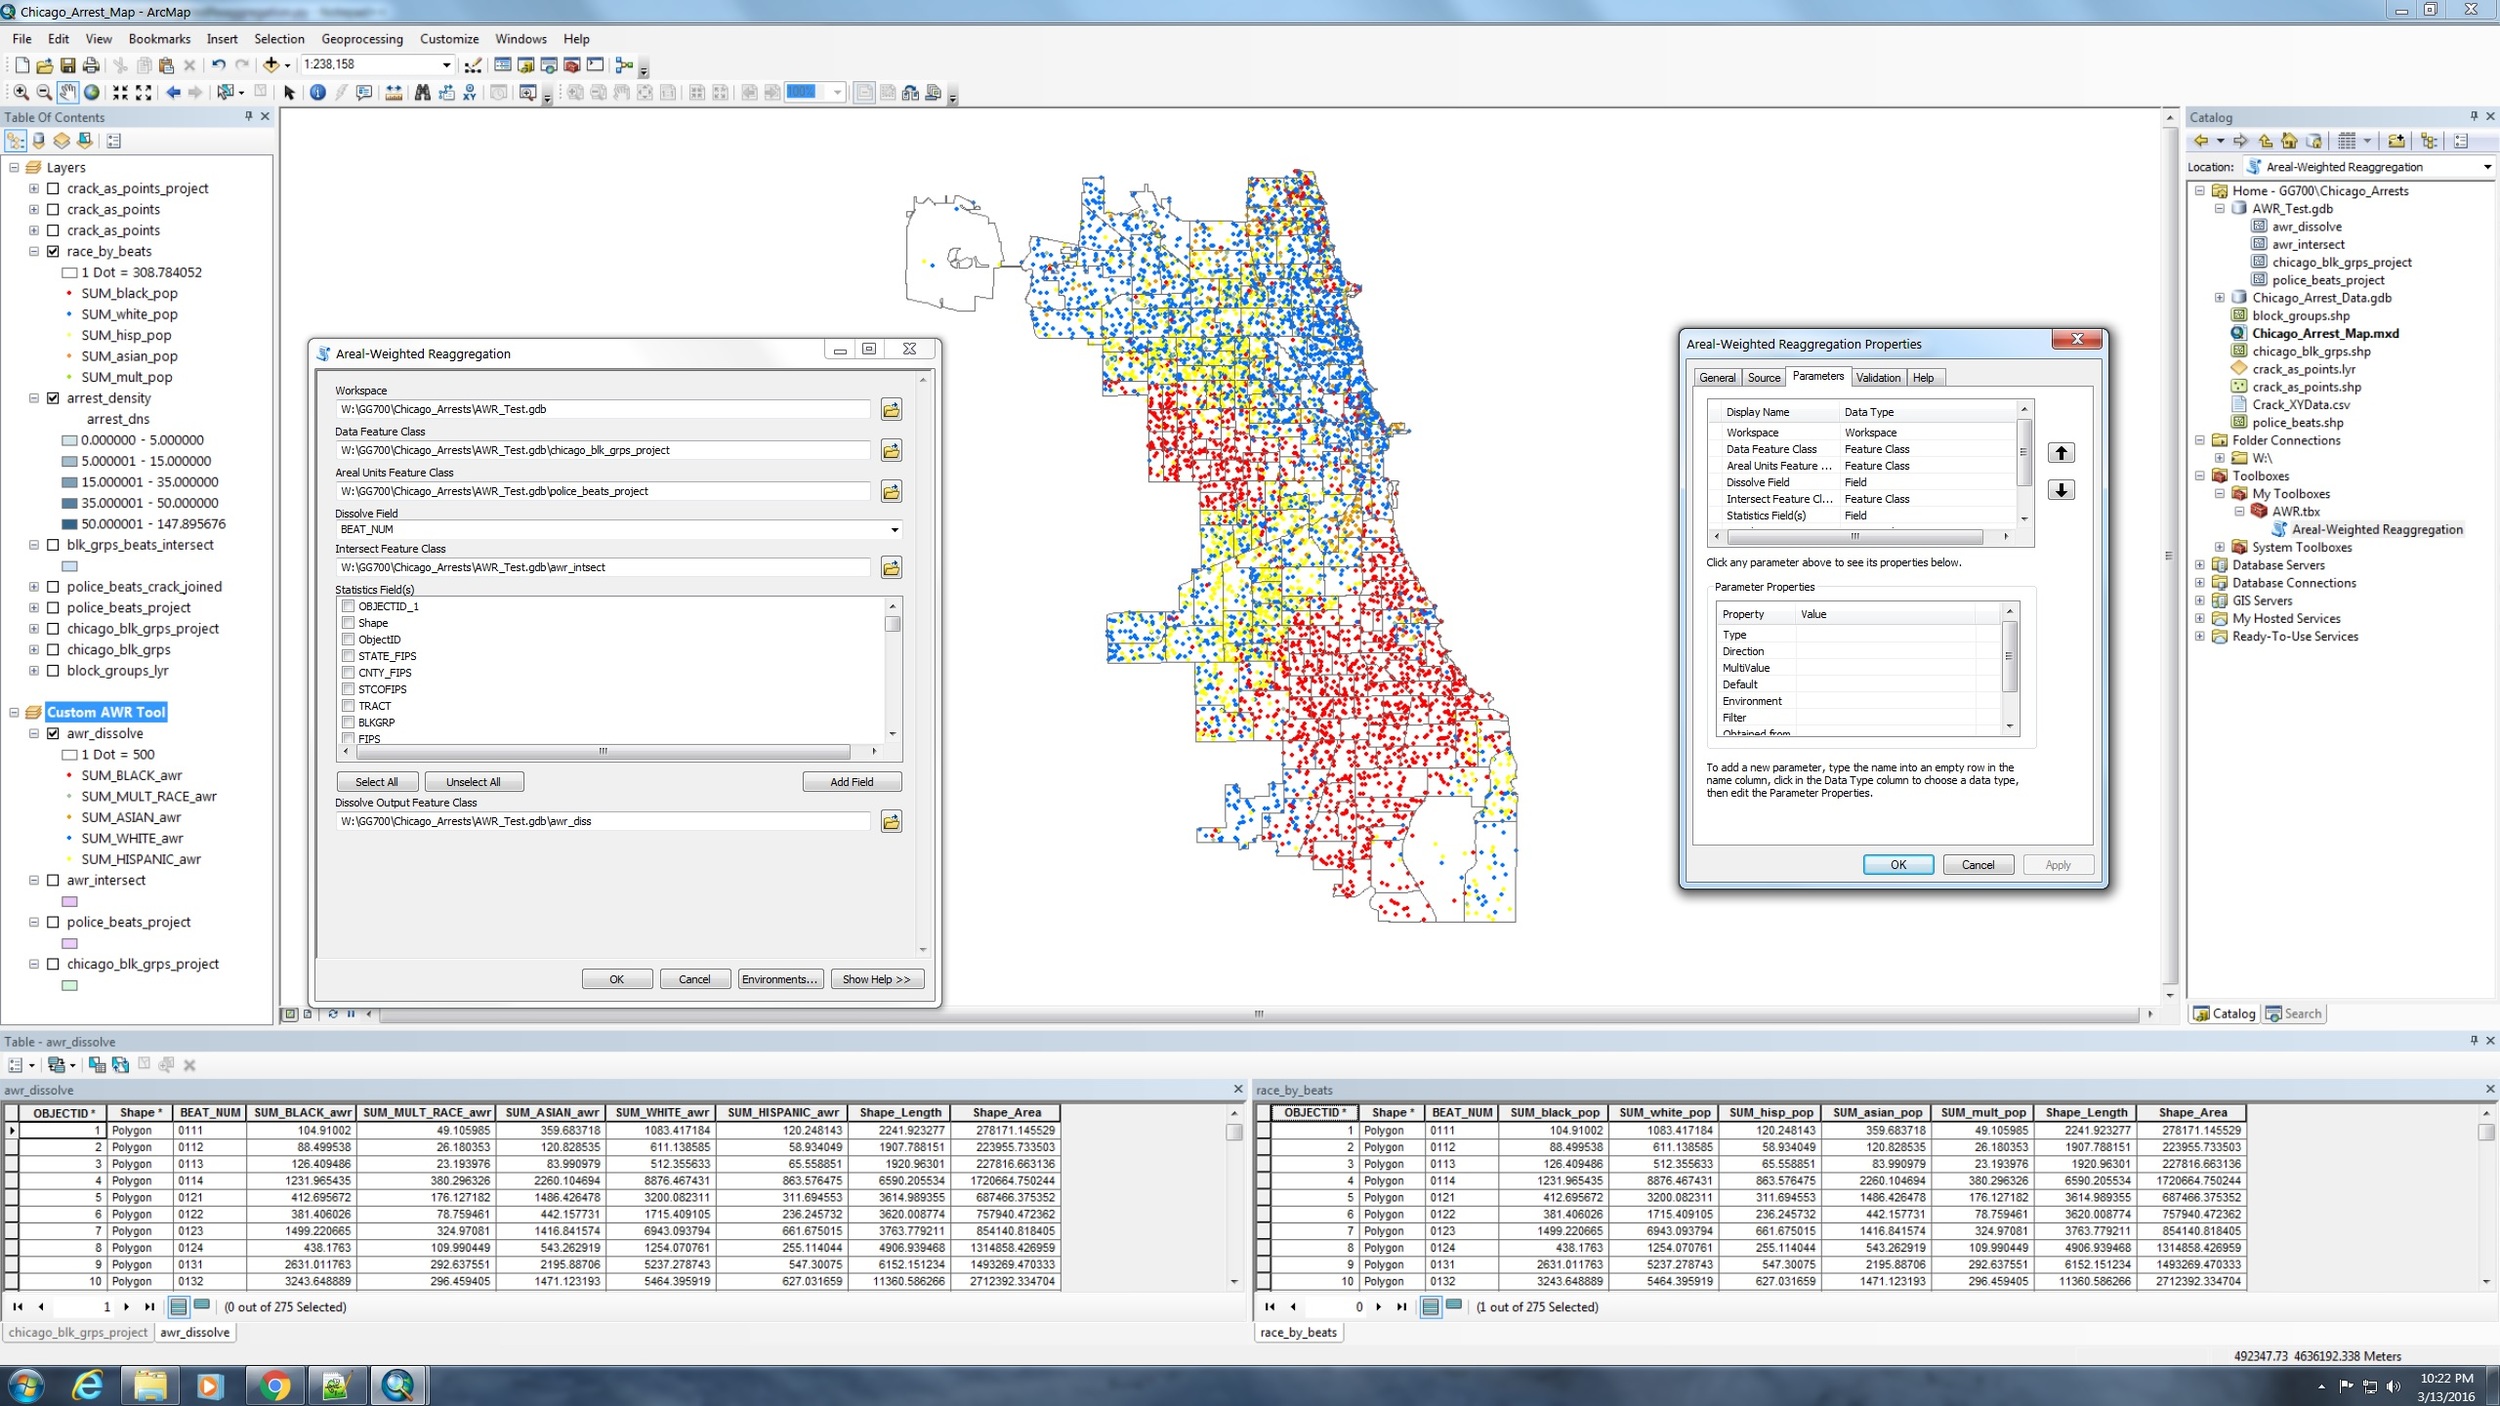
Here is the good ol' Chicago map once again. This time, however, I used my custom AWR tool to perform the analysis rather than the specific script from Project #1. Comparing the two attribute tables, we see that both the script from Project #1 and the AWR tool produce the same results. The GUI on the left is the AWR tool come to life, and the one on the right shows the Properties of the AWR tool.
Ultimately, it was a remarkably satisfying experience to write this tool and see it come to life. It was also a terrific lesson in learning how to abstract a specific problem into something that can be more universally applied. If you have further questions about how this tool works or how to get it to work in your own ArcMap project, feel free to reach out on Twitter. Check back in a few weeks for an update on my upcoming work with relational databases and my presentation at AAG!