Using NAIP Imagery and a Texture Raster to Model the Urban Forest
This post comes from a piece I wrote as part of Azavea's Summer of Maps program. To read the original post, head to the Azavea website.
As high-resolution satellite imagery becomes more accessible by the day, geographers, urban planners, and ecologists have begun to explore its potential for modeling the urban forest. However, attempts at precise urban canopy classifications often run into a few predictable problems. 30m or even 15m resolution still cannot model individual street trees or isolated stands. Classification algorithms confuse grass and other scrubby vegetation for the canopy. Shadows cast by adjacent trees affect spectral returns, leading to further misclassification. In short, mapping the urban forest in an accurate, detailed, and inexpensive way remains a challenge.
This post walks through a method to help increase accuracy of classification by using a texture raster to distinguish between trees and other vegetation.
What is NAIP Imagery?
In 2012, Chris Behee, a GIS Analyst for the City of Bellingham, Washington, introduced a fascinating methodology for working around many of these difficulties in a presentation at the annual Washington GIS Conference. His methodology takes advantage of a rich multispectral imagery repository – the National Agricultural Imagery Program (NAIP).
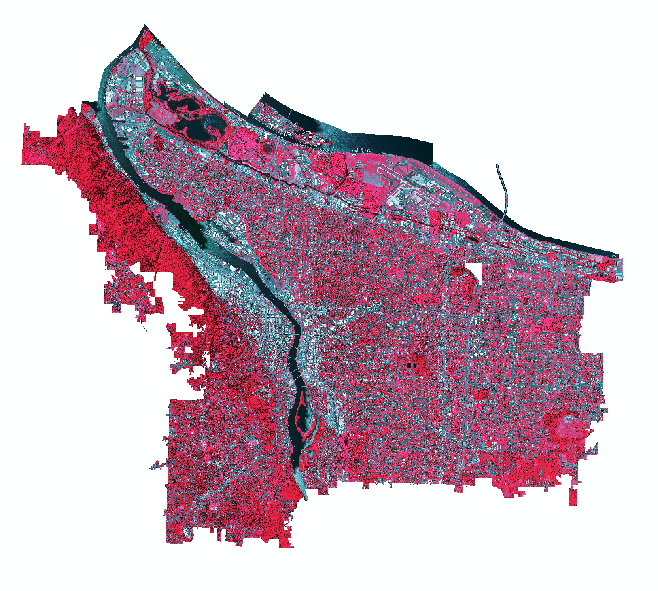
For those unfamiliar with NAIP imagery, it is collected (as of 2007) in four bands – the red (R), green (G), and blue (B) visible bands, and the near-infrared (NIR) band – at 1m resolution for the conterminous United States.
This makes it some of the highest resolution multispectral imagery that is publicly available today.
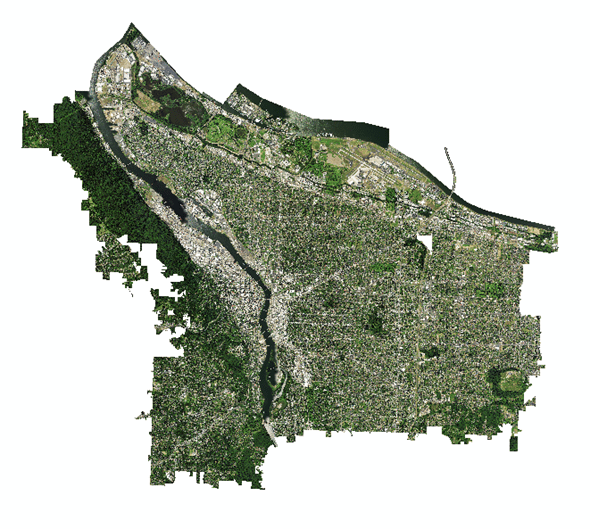
I decided to apply Behee’s methodology to my current work with Ecotrust, a Portland, Oregon-based non-profit. The project aims to use high-resolution imagery to:
- model change to Portland’s urban canopy over the last decade; and,
- explore correlations between the distribution of the urban canopy and socioeconomic and environmental factors.
Generating Classification Inputs
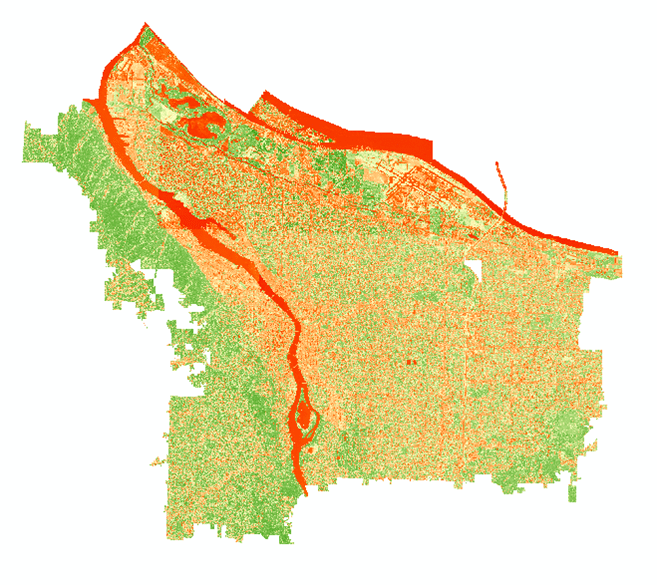
Behee’s methodology is based on using the iso cluster unsupervised classification algorithm with six different raster inputs – the four bands of the NAIP image, a Normalized Differentiated Vegetation Index (NDVI) raster, and a ‘texture’ raster. These last two layers are the real key to the classification. The NDVI raster is particularly adept at distinguishing between vegetated and non-vegetated surfaces. It does this by exploiting the tendency for vegetation to reflect strongly in the NIR band compared with other land cover types. However, the NDVI raster does not distinguish between trees and other scrubby vegetation or deal with shadows. This is where the ‘texture’ raster comes in.
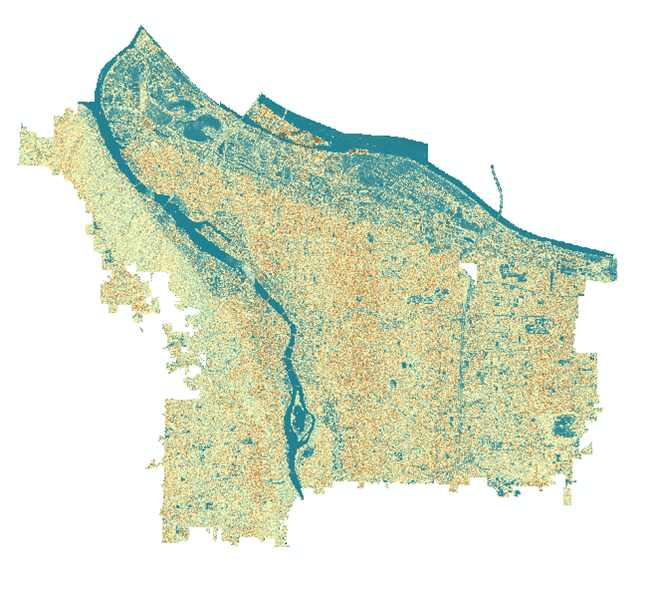
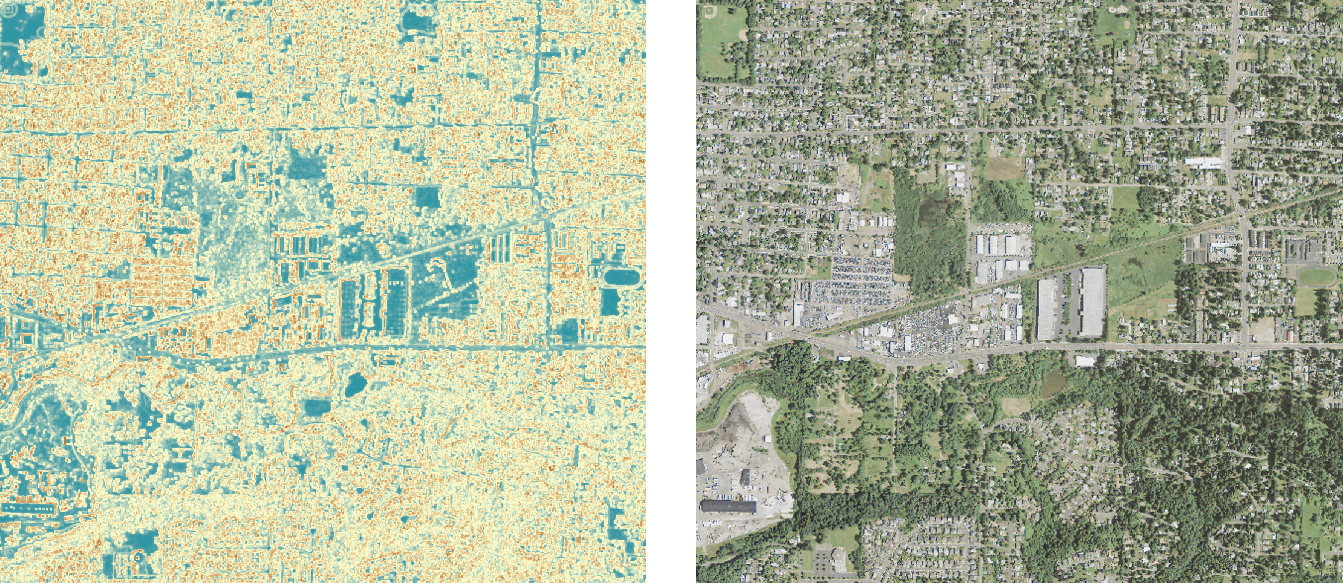
The Texture Raster
The idea here is that rather than relying solely on the spectral information of each individual cell in our raster, we should take into account the spectral information of the ‘neighborhood’ around the cell. If the surrounding cells have similar values, we can assume they are reflecting light similarly and that their texture is fairly consistent (like a mowed grassy field). But if they display greater variation in their values, we can assume they are reflecting light somewhat differently and that their texture is rougher (like the crown of a mature tree). In this way, the ‘texture’ raster provides information about not only color, but shape as well.
To obtain this final layer, we perform a Focal Statistics operation on both the G band and the NIR band of our NAIP image with a Range statistic and a 7 x 7 window. At 1m resolution, a 7 x 7 window corresponds roughly to the area of a mature tree crown. We finish by averaging the values of these two rasters together using Raster Calculator.
Running the Classification Algorithm
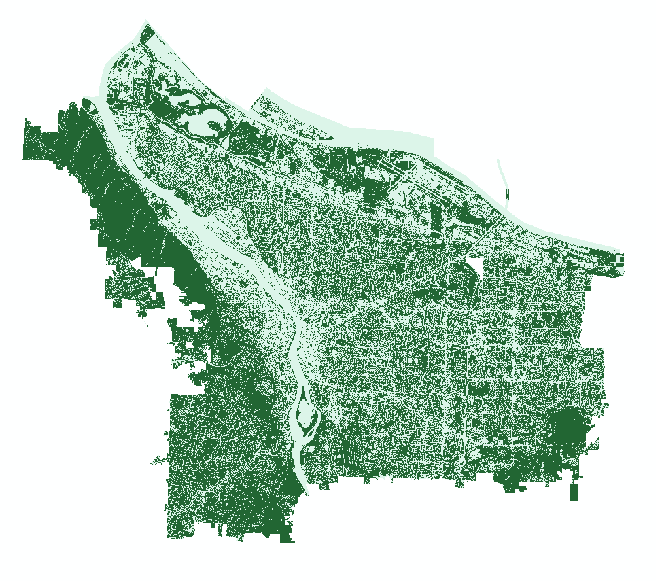
Loading these six inputs into my classification yielded some pretty exciting results. Obtaining a suitable level of precision did require requesting more classes than needed in the original unsupervised algorithm. I started with 50 classes and then manually recombined them to form a single canopy layer through visual inspection. I also engaged in several post-classification smoothing techniques, including applying a Majority Filter to take care of small holes in canopied areas and using a thresholded ‘texture’ raster as a mask to more precisely pick out trees in shadowy areas.
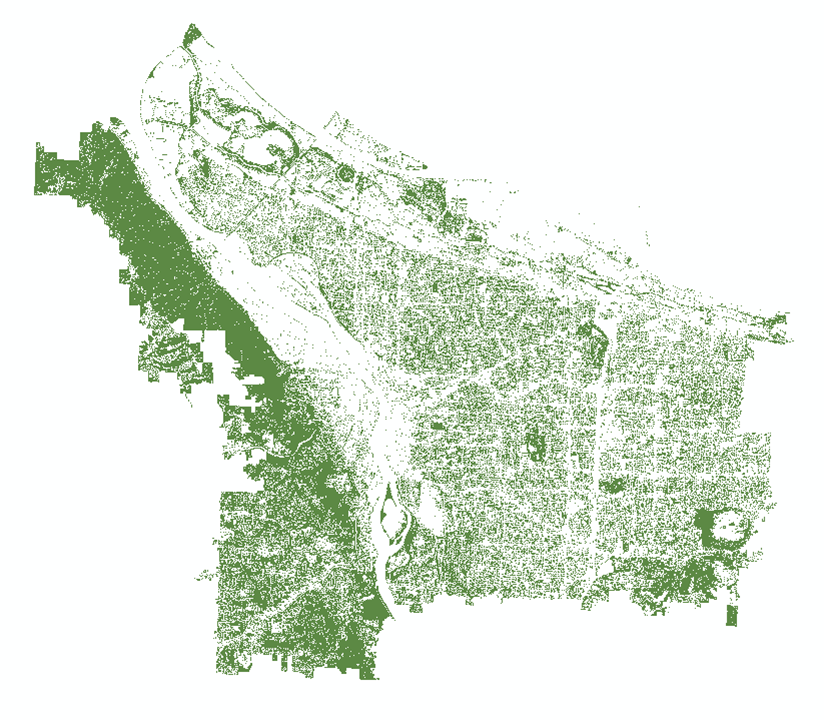
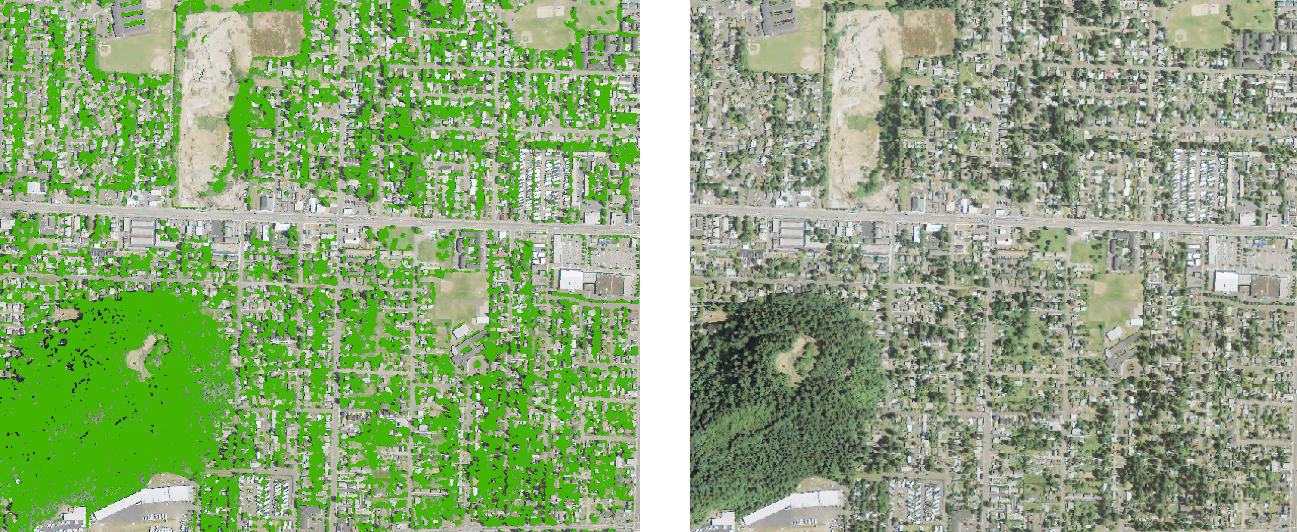
Classification Results
Ultimately, I found that Behee’s methodology, in conjunction with some post-classification smoothing and masking, created a pretty impressive canopy layer. There were lingering issues with detecting trees in shadowed parts of the image, which remains the major drawback of this approach. But compared with the more labor intensive process of gathering training data for a supervised classification, this method is far more lightweight and efficient, and works well for obtaining quick and precise maps of the urban forest.
You also don’t have to be a remote sensing expert to get it up and running! To obtain NAIP data for your state or city, head here or search for individual tiles on Earth Explorer.