Python Scripting for Automated Geoprocessing
When I first developed the syllabus for my senior research, I spent a lot of time asking fellow GIS students, professors, and analysts where they thought I should begin my study. And nearly everyone gave me the same answer – Python scripting.
Python scripting in GIS is primarily desirable because it allows you to automate almost all of the geoprocessing tasks you do in GIS without so much clicking. Rather than moving tediously from one GUI (Graphical User Interface, those pop up boxes where you tell a tool what files and parameters to use) to the next or attempting to build a flawless model from scratch, a Python script allows you to write code that is flexible, dynamic, and most importantly, adaptable to a variety of contexts. Let's say, for example, that you needed to project 1000 feature classes or run a particular technique on a group of shapefiles 500 times. Doing this manually would likely take days, if not weeks, of work. Conversely, a Python script allows you to direct the computer to a group of files and say, "Hey, could you bring these files into a GIS, run x, y, or z operations on them, and tell me what happens?" For me, Python scripts evoke a sensation of performing magic (particularly when layers you only conceived of creating actually start appearing on screen – ok, that's it for the meta stuff for now).
Another beautiful aspect of Python scripting is the ability to add a lot of creativity to your own geospatial analysis. Before I started scripting with Python, I didn't realize how much unseen functionality the folks at Esri and the QGIS Project had programmed into their geoprocessing tools, how many little details are taken care of for you. On the one hand, this is part of what makes GIS a lot more user friendly and approachable nowadays – you don't have to worry too much about the nitty gritty and you don't need to have a programming background to get started. However, I also think working exclusively with the built-in functionality of ArcGIS or QGIS confines you somewhat to very specific techniques or routines (which, ultimately, produces an inundation of very similar types of maps).
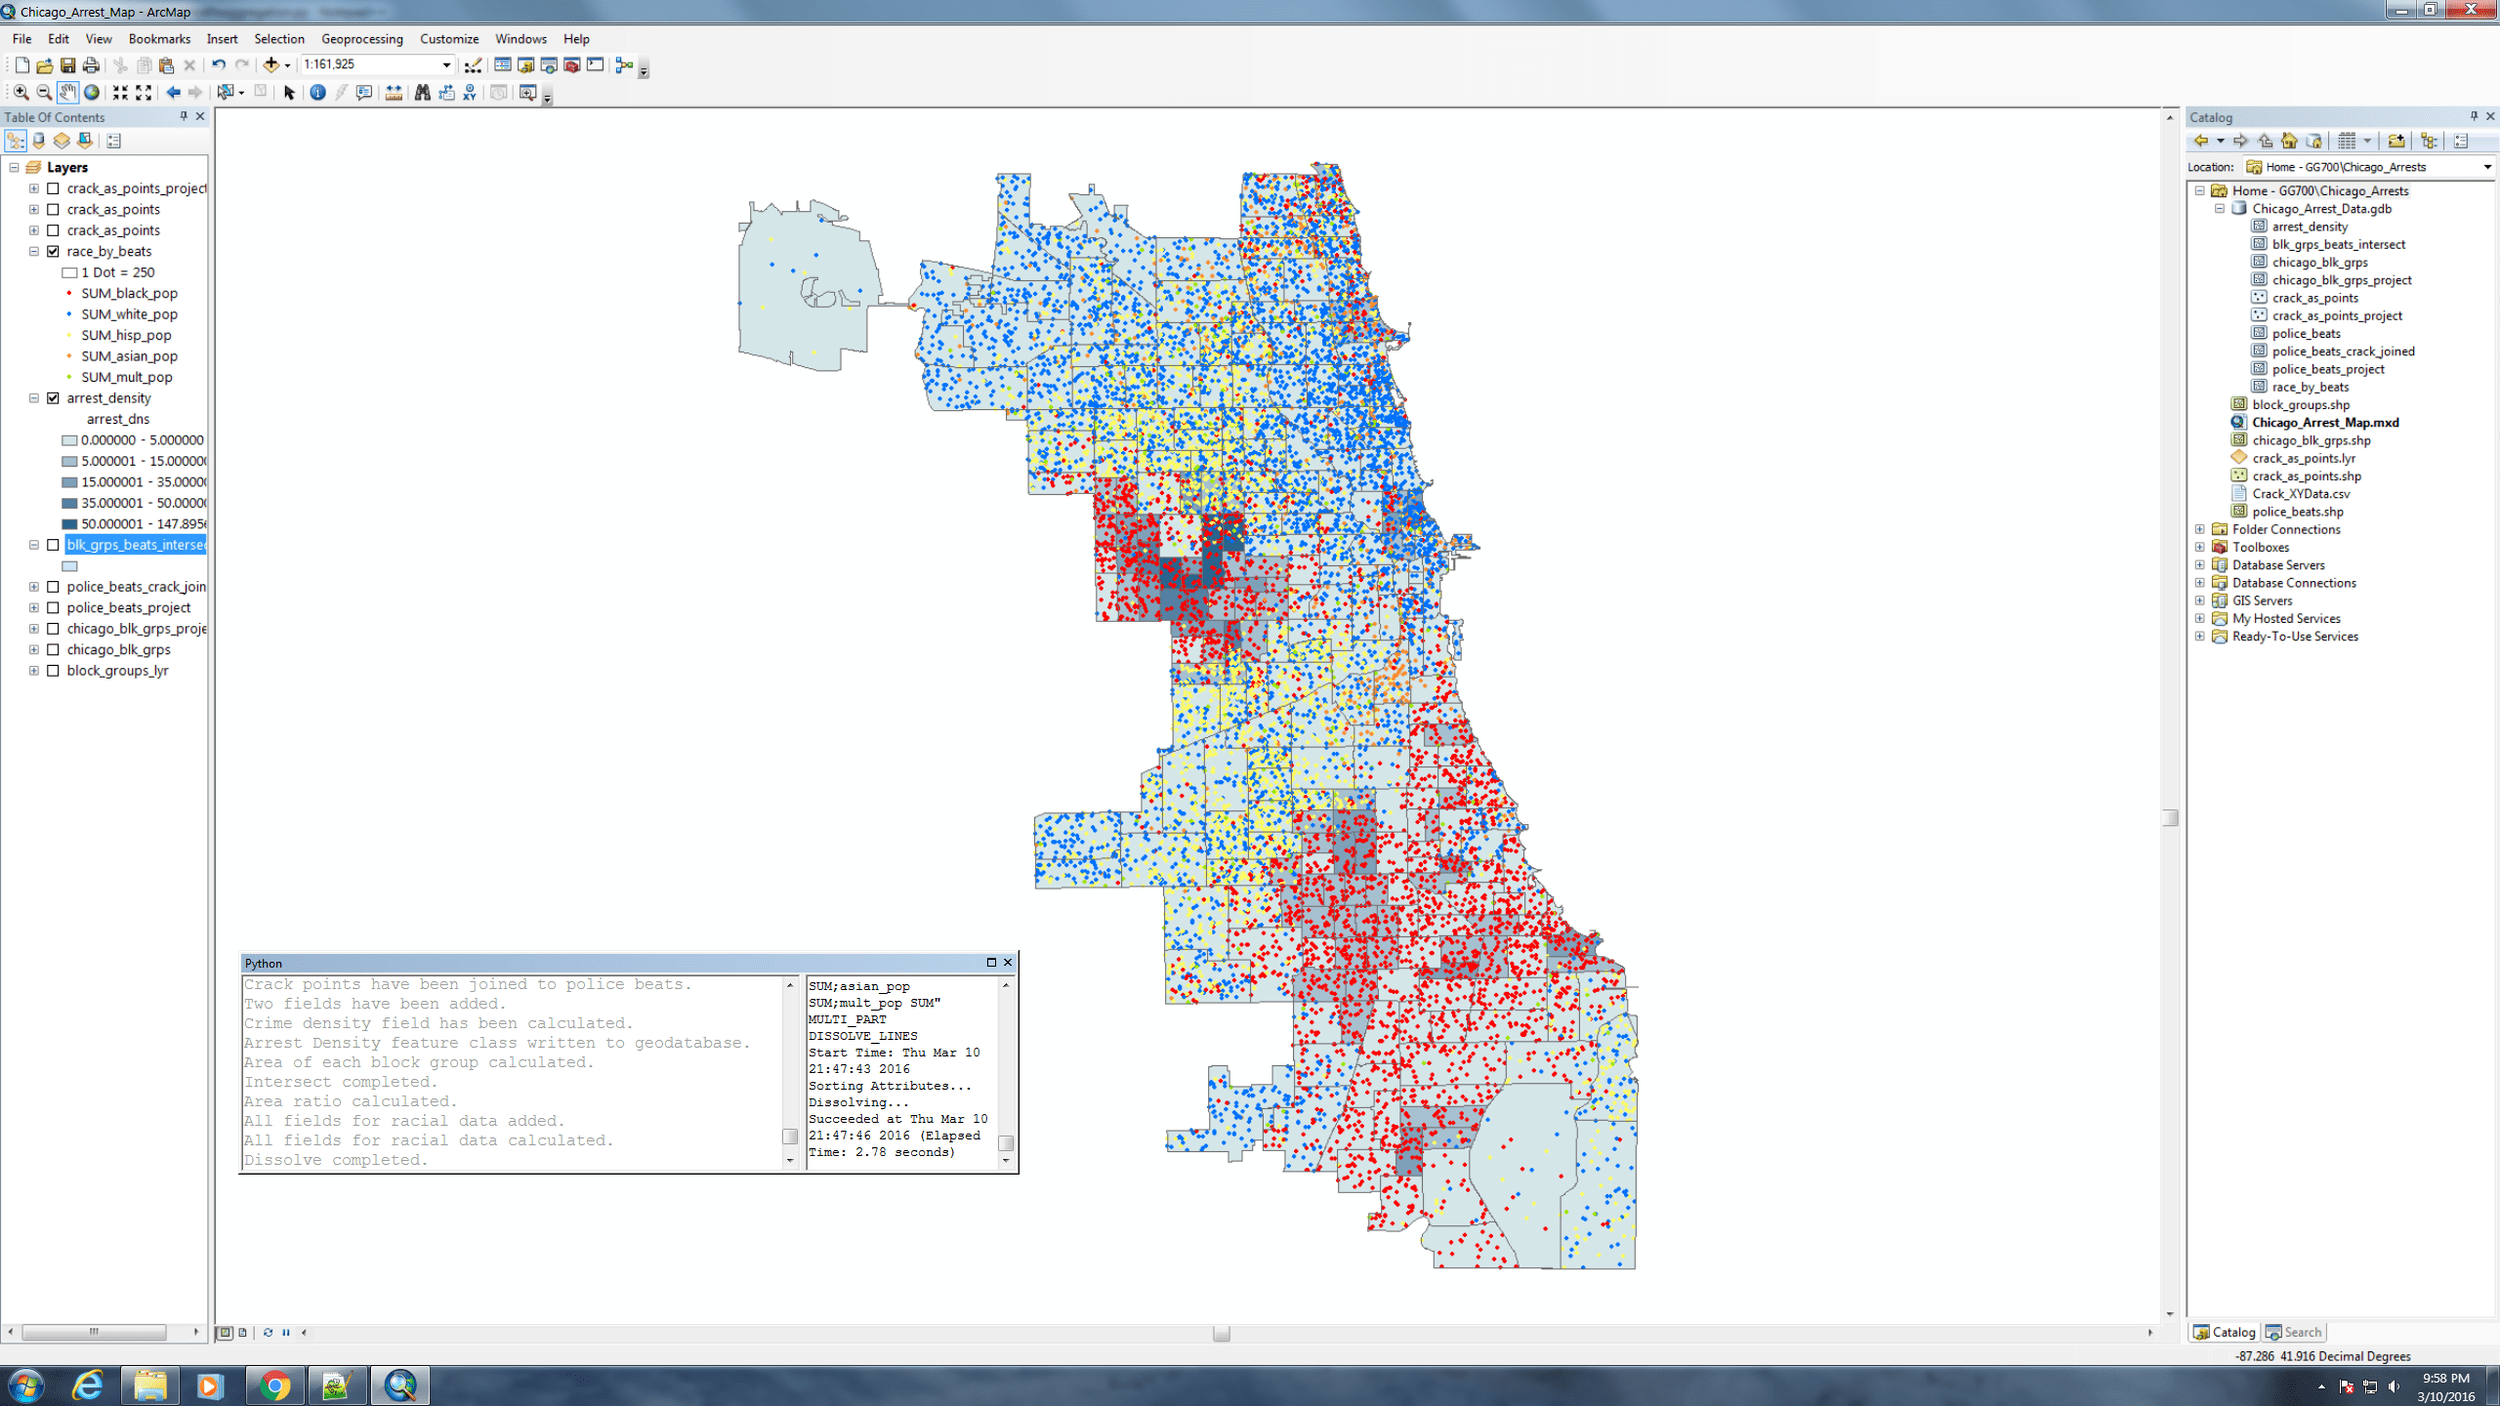
So, for my first project, I decided to tackle what felt like an ambitious project for a self-taught programmer like myself. Could I write a Python script that would make this map?
I made this map towards the end of last semester using data and a workflow courtesy of Professor Jeff Howarth in the Middlebury Geography Department. I did deviate in considerable ways from the original method for making this map, and dressed it up with my own cartography, but it was in many ways a standard GIS procedure for me. I used GUIs, Esri geodatabases, all of the built-in functionality I could get my hands on. The challenge now would be to see if I could do the same without so much support.
Fortunately, I did stumble upon a solid book to help me develop my scripting capabilities quickly, Python Scripting for ArcGIS by Paul A. Zandbergen. The book really focuses on using the ArcPy site package with ArcGIS to write effective, efficient code. It acts more as a conceptual skeleton than a How To guide, giving you the initial tools that you need to start exploring ArcPy and developing your own scripts. For this first project, I really wanted to stick with ArcPy because:
- it has a whole slew of solid methods and functions custom built for geoprocessing,
- it works seamlessly with standard Python functions (i.e. you can nest 'regular' Python functions into larger ArcPy functions), and
- there's well written, easy to use documentation available from Esri.
At the same time, there is some dissonance between the stated goals of my research and the choice to use ArcPy. It isn't open source (it is built directly into ArcGIS, a very expensive piece of software), it has a good deal of custom functionality that still obscures what's going on "under the hood", and code produced using ArcPy can't be run by folks not using the Esri suite of products. And so I want to take a moment to acknowledge these benefits and drawbacks in my decision, and to recognize that this tension between convenience and accessibility is palpable in the GIS world today and demands further investigation. I will continue to do that investigation throughout this semester. Now, on to the results!
Click here to access the script I used to make this map. Note that this script is specific to the files and databases written to my personal drive at Middlebury. If you want to replicate this map, you will have to grab the data yourself (don't worry, I give you some sources where you can find it in the comments at the beginning of the script).
This script took a fair amount of troubleshooting to actually work through. ArcPy requires very specific syntax and does not like to perform operations on conflicting data types (trust me, I found out the hard way). This is true of most programming languages, but what is perhaps more difficult with ArcPy is that you have to do a fair amount of data type conversion and concatenation to actually get seemingly simple calculations to go through. It's also difficult to iterate through individual feature classes to do specific operations on each of them. You'll notice that I used multiple for loops with lists and indexes to take care of this problem; you could also use cursors, although I find these to be a bit more cumbersome.
Getting this script to work was a remarkably satisfying moment for me. The only items the script starts with are a .mxd file (ArcMap Document file), a shapefile of police beats for the city of Chicago, a shapefile of all Census block groups for the united States, and a .csv file (Comma Separated Value file) with XY coordinate data for arrests for possession of crack cocaine. This means that the script takes care of:
- Setting Environments
- Creating a file geodatabase
- Performing a select by location to get block groups only for the city of Chicago
- Making an XY Event Layer to display the crime data and writing this data to a new feature class
- Converting all shapefiles to feature classes in a geodatabase
- Projecting all feature classes
- Performing a spatial join
- Running an areal-weighted reaggregation to get the number of people of each race by police beat across the city (this is the entire second half of the script and encompasses about 8 separate operations...but more on this next post)
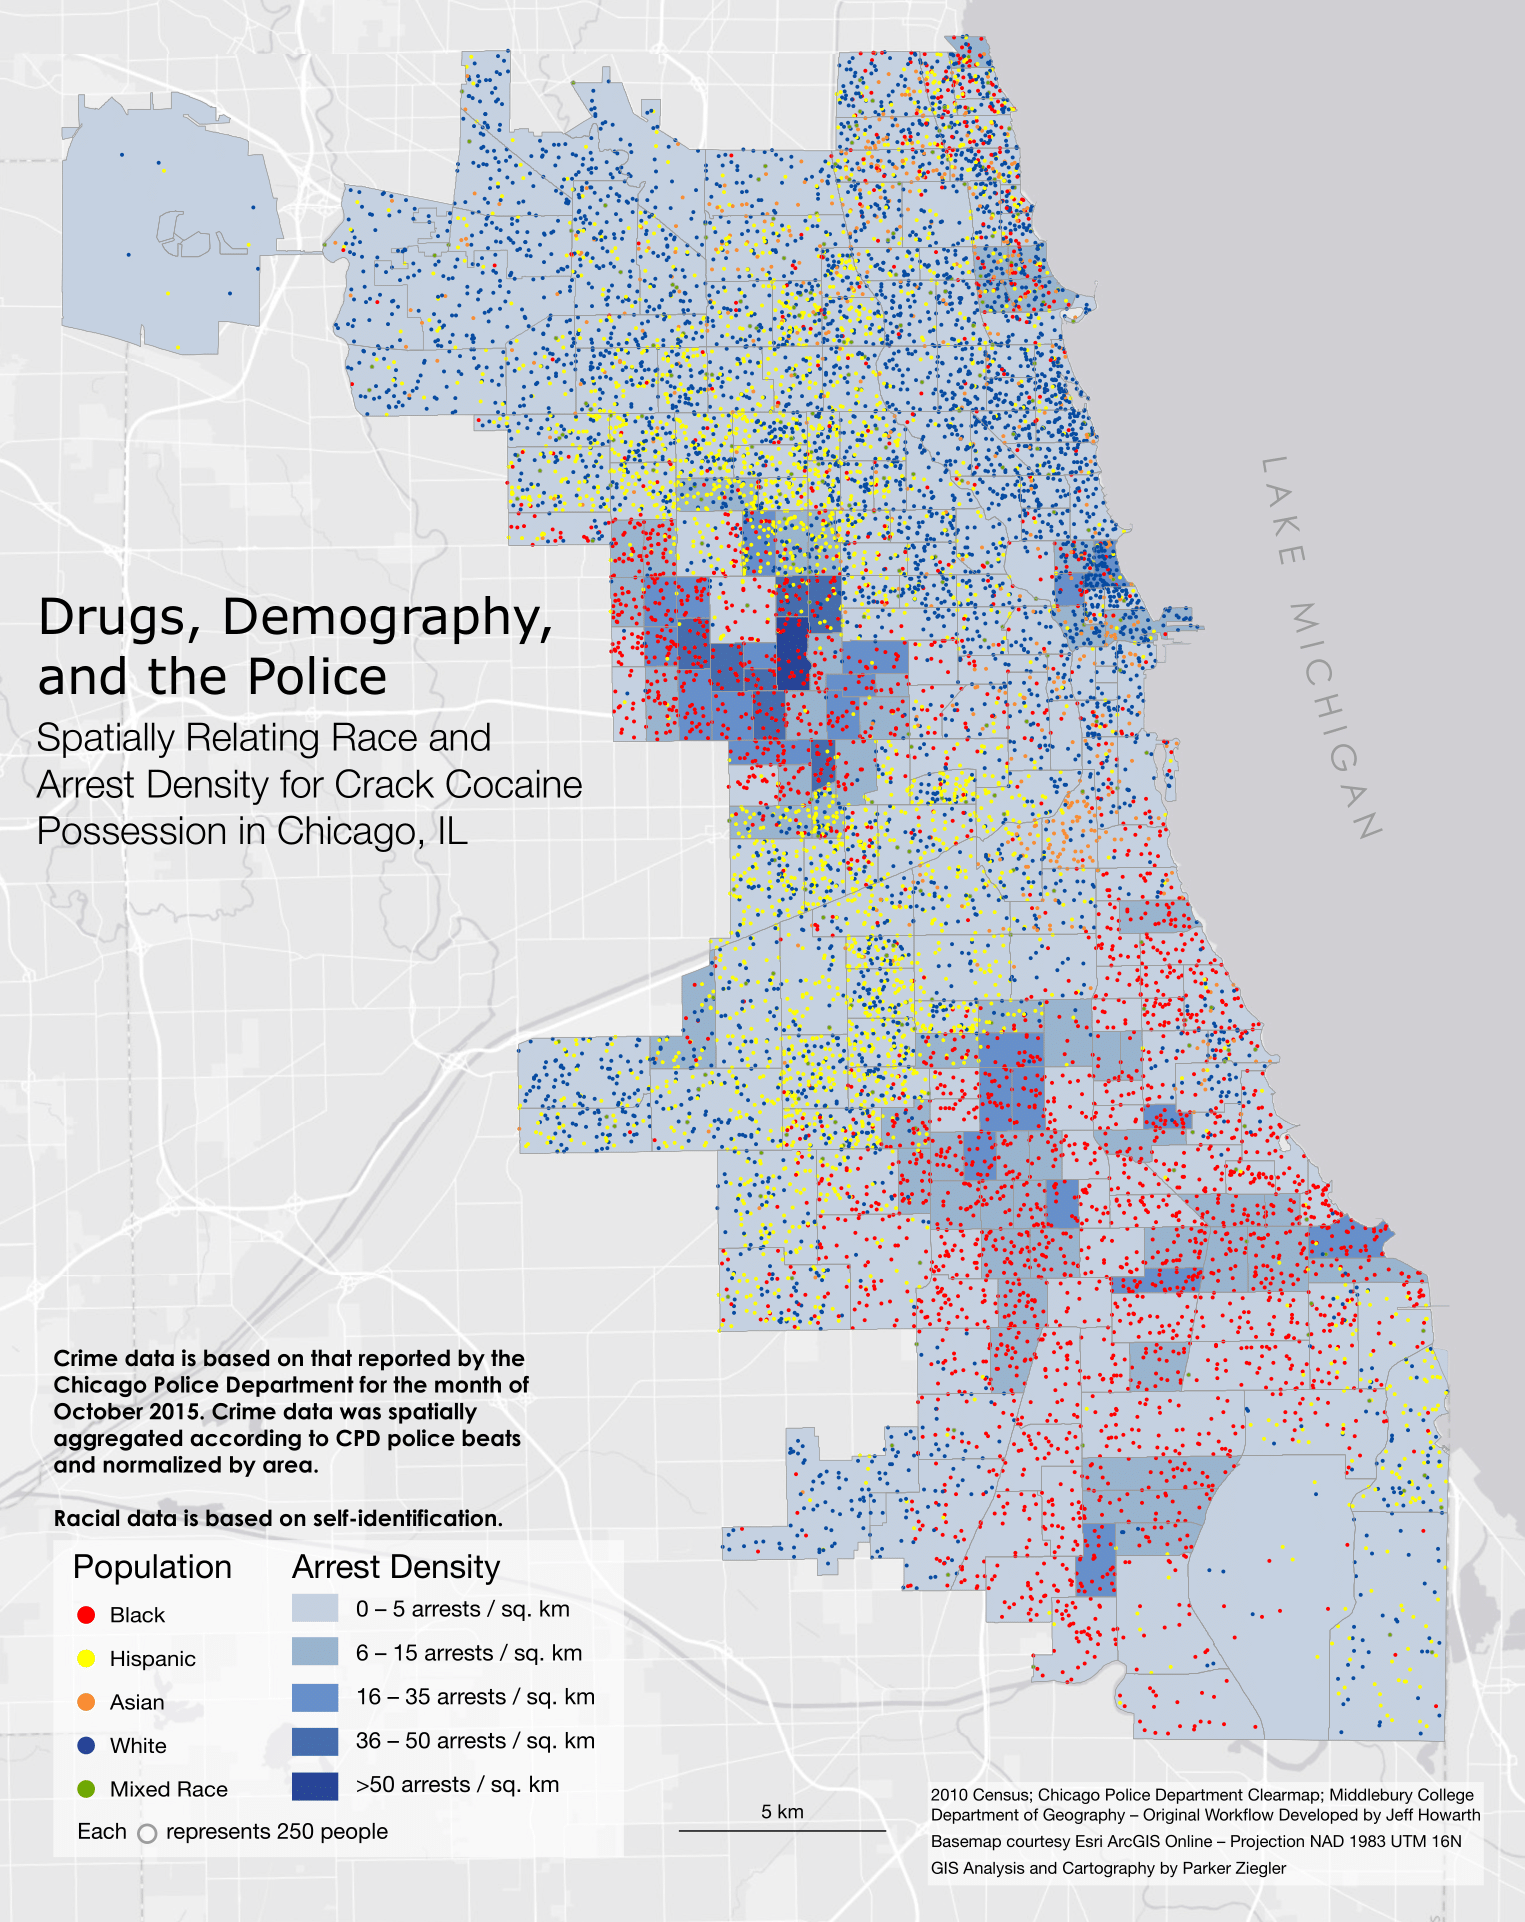
My hope is that in making this script available I can help others to write similar scripts that also take on the challenge of visualizing social injustice. While I am proud of the accomplishment, I am more excited about the story that this map tells - one of racially biased policing in a city that has seen too much violence. And so I am reminded that this thing I have made, this script, is only really as valuable as the story it helps to tell and the minds it helps to change. Below, you will find the map that this script produces (Note: you will have to do the symbology manually to get your map to look like mine).